
Spirion (Identity Finder) - Guide to the Administrative Console
Note: Spirion (Identity Finder) console access is reserved for campus information technology administrators and not campus end users. If you are interested in deploying Spirion and are not an IT administrator, contact cybersecurity@cio.wisc.edu to learn about your options.
For a shorter guide to the Spirion console, see the "Getting Started" KB article here: https://kb.wisc.edu/page.php?id=49577. This document is strongly recommended for first-time users, as it is a concise overview of the tool.
- Note:Screenshots were taken with Spirion 11. The steps have been verified through version 13.4, but the naming convention has changed. Text reflects the correct tag naming.
- Accessing the Console
The Spirion console is hosted by Cybersecurity at datadiscovery.cybersecurity.wisc.edu. The console can only be accessed if you are on UW-Madison IP space. If you would like to log into the console from an off-campus location you must use the WiscVPN (or other UW-Madison VPN) to access the console successfully. - Use your desired web browser to navigate to datadiscovery.cybersecurity.wisc.edu. You should be prompted with a login screen.

- Enter the credentials provided to you by Cybersecurity and click the Login button.
Note: If you do not yet have credentials to access the console, follow the steps in the kb article here to request access.
- You should now be logged into the console. Typically the first page you will see will be the Spyglass page, which provides aggregated information about the endpoints you manage. If you encounter any further issues logging into the console, please contact us at cybersecurity@cio.wisc.edu.

Creating and Managing Tags
Tags are a means of grouping endpoint assets within the Spirion console. Tags are especially useful when applying policies to your endpoints, as you can apply a policy to all the endpoints within a tag rather than individually selecting endpoints. You can also have different policies apply to different tags (e.g.: having a special tag for administrative computers with more personally identifiable information (PII) that scans more frequently and searches for more data types). Endpoints should automatically appear within your department's "top tag" upon running the installer provided to you by Cybersecurity; you are free to create and manage nested tags stemming from this "top tag" to suit your environment.
Note:
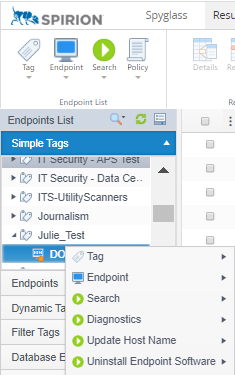
- It is important to note that if the machine name is changed locally on the endpoint the endpoint name within the console remains the same (doesn't change to the new name). It is recommended that you update the machine name in the Spirion console, as shown below. Right-click on the endpoint (old name) and select Update Host Name.
Viewing your tags
-
-
- Log into the Spirion console at datadiscovery.cybersecurity.wisc.edu, navigate to the Results tab, and expand the Simple Tags dropdown. Tags are also visible on the Status tab.
- Click on the Simple Tags dropdown to see the tags you’ve been provisioned within the console. Click the tag dropdown to show the machines within the tag. The tag name should be related to the department(s) you manage (e.g. Chemistry, WSOB, etc).

- Endpoints should appear within your top tag soon after you run the Spirion installer provided to you by Cybersecurity on those endpoints. If you don’t have an installer, follow the steps in the KB article here to obtain one.
- Log into the Spirion console at datadiscovery.cybersecurity.wisc.edu, navigate to the Results tab, and expand the Simple Tags dropdown. Tags are also visible on the Status tab.
-
- Creating new tags
Important: Top Tags in Spirion 13 follow a strict naming convention that isn't shown in the screenshots. Top Tags are created by Cybersecurity, in form <UDDS> - <DepartmentName>. The tag name precisely matches the group names used in Amp, which is necessary to track security data quickly in the event of an incident. This is why we ask department staff not to create Top Tags, or if it is absolutely necessary, to contact Cybersecurity for the correct form. - Log into the Spirion console at datadiscovery.cybersecurity.wisc.edu, navigate to the Results tab, and expand the Simple Tags dropdown.

- To create a nested tag within your tag, right-click your tag name within the Simple Tags dropdown, hover your mouse over the Tags option and select Create Nested Tag.

- Name your new nested tag and click OK.

-
-
- Moving endpoints to and from tags
- Log into the Spirion console at datadiscovery.cybersecurity.wisc.edu, navigate to the Results tab, and expand the Simple Tags dropdown.
- To move machines from the top tag to a new tag, select the machines you wish to move. Right-click one of the machine names, hover your mouse over Endpoint and select the Move to Tag option.

- Select the tags you wish to move the endpoints to, and click the Move button.

- The endpoints should now appear within the tag.

- Moving endpoints to and from tags
-
- Managing Scan Results
Viewing and analyzing scan results is the primary reason for the Spirion console's existence. On the Results tab you can view the results of scans for endpoints or tags you manage and take various actions on the results.
- Viewing results in the console
- Log into the console at datadiscovery.cybersecurity.wisc.edu, select the Results tab, open the Simple Tags dropdown, and click on your tag name (or expand the tag name and click on the specific endpoint you wish to see results for). This will populate the Results window with scan results from endpoints under the selected tag.

- In the Results window you can view information about matches found via searches such as the match location, the endpoint the match was found on, the most recent time a match was found, and any actions taken on those matches.
- Another valuable field is the Match Type Field, which shows a colored icon indicating the type of match that was found. Hovering your mouse over this icon will identify the type of match it represents (shown example is the SSN icon). There are separate icons for each match type, including custom regular expression matches.

- It is possible to change the information fields shown in the results scan. This can be done by clicking the Ellipses on any of the columns currently showing, hovering your mouse over the Columns option, and clicking the fields you wish to see in the results pane.

- Tree View can be useful for grouping matches. For example, you can change the results to be grouped by location by doing the following: Clicking the Display button in the top bar, clicking Tree View, hovering your mouse over the Group By option and selecting Location.
Note: When using the tree view with 100 or more endpoints under the same top tag, the connection to Spirion may drop, resulting in a browser error such as "Aw Snap." This is a rare event, and the recommended action is to reconnect and try again. - Selecting Tree view and grouping by location will look like the following screenshot:

- Acting on results in the console
- Click on the Simple Tags dropdown to see the Tags you’ve been provisioned within the console. Click the tag dropdown to show the machines within the tag. The tag name should be related to the department(s) you manage. Click on your tag name to populate the results window.
- To act on results in the console, simply select the rows of matches you wish to act on, right-click them, and select the action you wish to employ. The available actions and their descriptions are below.

- Remove: The Remove button will remove the matches from the console. It should be noted that removed matches will reappear if they are scanned and found again.
- Shred Location: Shredding the location will irreversibly delete the file in which the match was found. Only do this if you are certain that you are authorized to delete the file.
- Redact: Redacting the match will replace the match with X's in the location without destroying any of the other information in the file. The redact option can't be used with certain files (e.g. compressed files). Although this leaves other information in the file intact, it is an irreversible step. As with shredding, it may be used only when authorized to delete data. This option, while useful, does occasionally fail or run into issues. It is important to follow up with further scans to ensure that the match is redacted successfully.
- Quarantine: Quarantining the file will move the file and its contents to an encrypted quarantine folder on the local machine. Be aware that this action uses API calls to the computer's operating system. It is not recommended unless you are familiar with how the feature works on the computer that stores the data.
- Restrict Access: Restricting access to the file allows you to choose certain groups of users or certain levels of permission needed to open the file. As with quarantine, it is not recommended because permissions work differently in different operating systems, and it is easy to "lock out" people who should have access to a file.
- Ignore--This Match: Selecting to ignore the match will ignore the match in that location for current and subsequent scans on the device.
- Ignore--This Location: Selecting to ignore the location will ignore all the matches in the location for current and subsequent scans on the device. This is the best action for files that do not actually contain restricted data. While the tool and configuration are designed to minimize false positive results, eliminating them is unrealistic.
- Classifications: This option allows you to classify the match. Classifications allow you to track the severity of the match, ranging from Low to Confidential. It is possible to create custom classifications in the Workflow tab in the console.
- Click on the Simple Tags dropdown to see the Tags you’ve been provisioned within the console. Click the tag dropdown to show the machines within the tag. The tag name should be related to the department(s) you manage. Click on your tag name to populate the results window.
- Viewing results in the console
Creating and Managing Scan Policies
Spirion policies allow you to configure virtually everything about the Spirion endpoint client. Items like filepaths to scan, data types to look for, what data to send to the console, types of scans to run, and more can all be adjusted in the policy settings. Cybersecurity manages a baseline policy that have been configured optimally for searching for SSNs and credit card numbers, which you may choose to apply to your endpoints.
- Overview
Because of the large number of configuration options available, policies are an extremely flexible way to manage many endpoints from a single source. At the same time, it is easy to overlook important settings and can be quite time consuming to create a policy from scratch. Because of this, Cybersecurity has created a standard policy that provides a complete, optimized configuration for scanning of Social Security numbers and credit card numbers, which are two very common forms of restricted data. It is called CYBERSECURITY_RECOMMENDED_DEFAULT. Departmental IT administrators are welcome to use this policy for configuring endpoints and will only need to setup a scan schedule.
NOTE: This guide will not attempt to explain every policy setting that can be configured. Settings that have been deemed critical to the function of the Spirion client and those that are non-critical but used commonly will be discussed. Administrators are encouraged to explore the available options using the Console's built-in help window. When viewing a policy's settings, the help window for a particular setting can be accessed by double-clicking the setting name and navigating to the "Explain" tab.
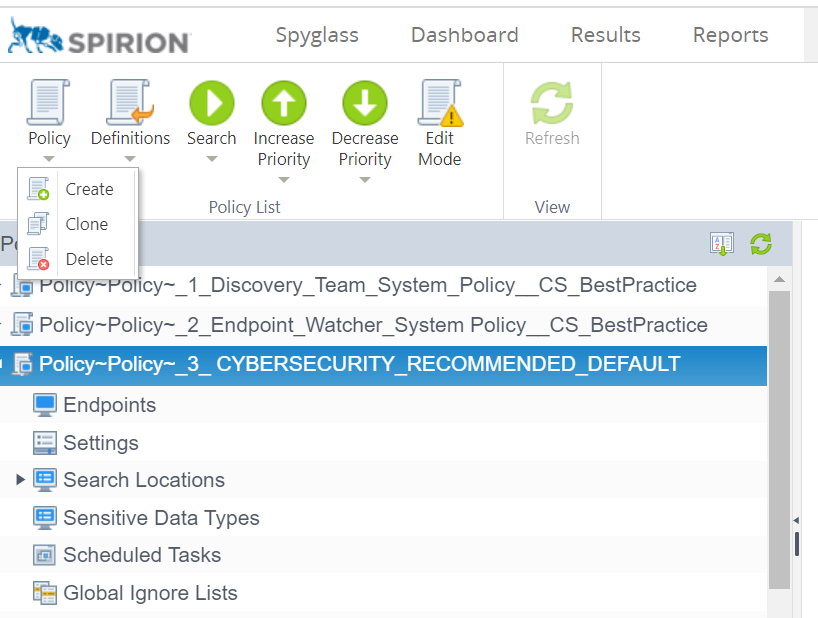
- Spirion 13 has only a single default Policy, _3_CYBERSECURITY_RECOMMENDED_DEFAULT. It was developed based on the most commonly used and effective settings tested in earlier versions of the tool.
- Scheduling scans with the recommended default policy.
To help provide a higher degree of flexibility to each department, the default policy not define any sort of scan schedule. Below is a step-by-step guide to creating a Scheduled Task policy that can be used in conjunction with the default policy to do automated scanning of your endpoints. - Log into the Spirion console at datadiscovery.cybersecurity.wisc.edu and navigate to the Policies tab.
- Click the Policy drop down button in the top bar, right-click the default policy, and select the Clone option.
- You will be taken to the "Policy" tab of the Policy Wizard. Specify a name for your policy, add an optional description, and choose the policy type. While descriptions are optional, it is good practice to include a brief description of the policy's intent for other administrators who may view it in the future. To base your policy on the default, you have cloned a system policy, which will come up as another system policy by default. Do not forget to change the policy type to Scheduled Task as the policy type! Uncheck the "Specify settings to be used during the tasks specified in this policy" check box. Once you're ready to continue, click the Next button.
Cybersecurity recommends you use the "TagName - Policy Title" format when naming your policy. Remember to include the UDDS code. While you may only see the Cybersecurity baseline policies in your policy list, there are in fact dozens--if not hundreds--of policies in the Policy List, all hidden from your Console Role. Because of this, simply naming your policy "Automated Scan every 6 mo." or "2023 One-time scan" does not provide sufficient information for identifying which policies belong to who and what policies are still in use. Cybersecurity will periodically remove policies which do not provide sufficient identification information in their titles without warning if there are no means of identifying the owner of the policy.
- On the Schedule tab, click the Add button in the top ribbon to set up a scheduled task.

- Pick a frequency and time for the scan to occur, and adjust scan options according to your preference and environment. Click OK once you're done creating the scheduled task and click Next to move on to the Endpoints tab. Additional information on scan options is below.
- Run this search as this user:
- Local System Account (recommended): Runs the scan entirely in the background and has the capability to search all directories. Users are not notified of the scan's occurrence or results.
- Locally Logged on User (Interactive): Runs the scan and notifies the user that the scan is occurring. Once the scan is done, users can see the scan results and act on them. Results will be sent to the console once users have closed out the results.
- Locally Logged on User: Runs the scan as the logged in user but does not notify the user that the scan is occurring nor does it shows them the results once the scan is finished. We generally recommend to use one of the other two options, not this option.
- If Spirion is already running when this task begins, this task will:
- not stop any instances of Spirion: Waits until other instances of Spirion have been closed or stopped before scanning.
- only stop the same instance of Spirion: Stops the same instance of Spirion (for instance, if the scheduled scan is a daily scan and the last scan hasn't completed yet, this option will kill the previous day's scan and start scanning).
- stop all instances of Spirion and run this search (recommended): Stops instances of Spirion that are already running (useful in the case that a previous scan is hanging). This is the most reliable option to ensure that your scans run in a timely manner.
- When task missed:
- do not run: doesn't run the search if the task is missed (not seen by the endpoint after several days).
- run as soon as possible (recommended): runs the task as soon as the endpoint is aware of it - even if that is after several days.
- run with randomized start time: allows you to choose a randomized start time for the scan if the task was missed on the endpoint.
- Expire this task (never run after): allows you to pick a time when you want the scheduled scans to stop occurring.

- Run this search as this user:
- The Endpoints tab allows you to select one or more tags to which this policy will be applied. Select the checkboxes next to the tags you wish to apply the scheduled task to. You can also apply your policy to individual machines by expanding the tag groups with the triangle button and selecting the checkboxes next to the machines you wish to apply the scan to. You may also choose not to immediately specify tags and edit the policy to assign tags at a later time.

- Once you're done configuring all of the tabs in the scheduled task policy, click the finish button to apply the scheduled task to the endpoints and tags you selected.
Creating a custom policy
Some administrators prefer to have more autonomy over the policy configurations applied to their endpoints. Admnistrators may choose not to apply the default policy, instead opting to create custom policies of their own. For help with creating a custom policy, refer to the KB article here: https://kb.wisc.edu/internal/page.php?id=92740.
- Creating and Managing Reports
Spirion allows for custom report building and reporting, which can be very useful for gathering insights into your environment.
- Creating a custom report
- Log into the Spirion console: datadiscovery.cybersecurity.wisc.edu,
- Navigate to the Reports tab.
- Click the Report button in the top tab and select the Create option.

- Name the report with the following syntax: [your tag name] - [report purpose] and enter a description for the report. Do not forget to include the UDDS code as part of the tag name. Leave the SQL Query Method set to the Select automatically once radial button. Click next to move on to the columns page.
Caution: Although the reports tab has a checkbox that allows you to join this report to another report, the process can create extremely large temporary files that exceed the capacity of our server. There are workarounds, but they only apply to small departments. Avoid this option unless you have discussed the issue with Cybersecurity. 
- The Columns tab is where you will build your report. The Available Columns pane contains various categories of column data you can choose to include in the report. Click on the arrow next to a column category to view the column data available for that category. The screenshot below shows the available columns from the Endpoints category.

- Select columns to include in your report by dragging and dropping them into the Selected Columns pane. You can use columns from more than one column category in your report (for instance, you can use the Endpoints - Endpoint Name column alongside the Matches - Match Quantity column). Once you're done building your report in the Columns tab, click Next to move on to the Filters tab.

- The Filters tab allows you to filter the results based off of the columns you included in the report. For instance, if you included Endpoint Name and Match Quantity in the report columns, you can filter the results of the report to only include endpoints with a certain endpoint name or number of matches.
You can only filter based off of columns in the report - you cannot filter off of an item that is not in the columns of the report. For instance, if you only included Endpoint Name and Quantity of Matches in the report, you can't filter by endpoint tag. Tag Name must be included as a column in order to filter by tags.
- Once you're done with the Filter tab, click Next to continue to the Permissions tab. This is where you can provision access to the report you created. Generally, you will want to make the report accessible to other users within your role, which can be done by scrolling to your role in the table and checking the View and Edit checkboxes. Generally it is not recommended to provision access to your reports to other roles that are not your own as it will add to the clutter on their report tab (only do this if specifically requested by a user with a different role).

- Requesting a scheduled report (sent via email)
Spirion has the capability to run reports on a scheduled basis and it is possible to configure email notifications containing a link to the results (results are stored securely on the console). If you have a report you'd like to receive on a regular basis, please reach out to cybersecurity@cio.wisc.edu and we will work to set up a service task that will run the report and send you an email with a link to the results. Make sure to include the name of the report and frequency that you wish the report to run in your email request.
- Creating a custom report