
Comparison of Greenhouse Gas Emissions from Beef Finishing Systems: Feedlot vs Pasture
Douglas Lee, dlee246@wisc.edu
Rachel Carlson, rmcarlson3@wisc.edu

Scenario
Whole Foods is looking to increase their premium from grass-fed beef using the claim that beef steers raised on pasture emit less greenhouse gas (GHG). They wish to find research that supports their claim and thus have asked students from the University of Wisconsin for help with the research. Our goal is to use a literature review of past studies on each finishing system to answer whether pasture finishing systems emit less GHG than feedlot finishing systems or not. Using those findings, we will conclude which system is associated with less GHG emissions. Upon making our conclusions, we will meet with Whole Foods to discuss the results. After the discussion, it will be up to Whole Foods to decide if they can increase their premium based from grass-fed beef. Below is the report on our findings of GHG emissions from feedlot- and pasture- finished beef.
Abstract
There is interest in comparing the greenhouse gas (GHG) emissions from feedlot versus pasture beef production systems due to increasing concern over global warming and the potential for a premium for products that address that concern. To make that comparison, a literature review was used to perform a finishing phase to dinner plate life cycle assessment of the two production systems. It was found that while feedlot-finished beef had lower GHG emissions for enteric fermentation, feed production, and manure management, GHG mitigation from carbon sequestration had a high enough impact in pasture systems that the total GHG emissions from pasture systems was lower than from feedlot systems. From that result, there may be justification for a premium on grass-fed beef based on the claim that it is associated with less GHG emissions.
Introduction
| Feedlot |
Pasture |
|---|---|
 Photo: AmericanCattlemen |
 Photo: Midwestsustainable |
|
|
Details of Pasture finishing systems:
Benefits
- requires small amount of inputs (e.g. fertilizer mainly)
- more sustainable in long term because the large amount of feed required for cows grows naturally. One quarter of the earth’s surface is grassland so there is an abundance of land available with a sustainable food source for cows (Soussana 2009).
- take advantage of ruminants ability to convert human inedible vegetation into a highly nutritional food source (Lozier 2008).
Negative Aspects
- Low amount of digestible energy in grass.
- On pasture longer so more enteric emissions compared to feedlots.
- Generally a lower weight
Details of Feedlot finishing system:
Benefits
- Faster finishing time-less enteric fermentation emissions
- Higher finishing weight-more productive
- Don't need special type of land to have feedlot (compared to pasture finishing systems needing grassland)
Negative Aspects
- Need to import food
- Farther from slaughterhouse (Clary 1986)
- Need to manage manure
Main Objective of Study
If GHG emissions are lower for pasture-finished beef, then this could potentially provide a price premium, allowing pasture based systems to be equally profitable to conventional feedlot finishing systems despite slower growth rates and lower average weight gain.
So... Will pasture based finishing systems have less GHG emissions compared to feedlot systems?
Materials and Methods
Life Cycle Assessment
To make a comparison of the GHG emissions from pasture-finished beef and from conventional feedlot-finished beef, we performed a finishing phase to dinner plate life cycle assessment (LCA) of the two types of beef production systems in the upper Midwestern United States. Finishing phase refers to the stage of beef production where the animal has been weaned and is being fed to gain weight for slaughter. Dinner plate refers to the plate of the consumer, which means we will attempt to include emissions from transportation and processing necessary for the beef to reach the consumer. We had to limit our study to one region because climate has a big impact on the different aspects of beef production and different regions will have different climates and other variables. We chose the upper Midwestern United States as the location for our study because one can easily find both types of beef production systems there due to the availability of both pasture and grains.
Often, LCAs are performed using a cradle to farm-gate analysis due to the ability to quantify the whole farm’s contribution to GHG. However, in beef production systems, the cow-calf phase is similar regardless of the finishing system. While various studies (Pelletier et al., 2010; Crosson 2011) have found that the cow-calf phase is the highest source of GHG emissions, the GHG emissions from the cow-calf phase are similar and makes the cow-calf phase less important in differentiating between the two systems. Thus, we set the starting boundary of this LCA to be the start of the finishing phase, where management practices are dramatically different. Furthermore, this boundary eliminates from the LCA extra variables due to the mature cow in a cow-calf system and its emissions. Mature cows have higher emissions due to greater feed consumption than growing beef steers and do not contribute to the product because they are retained in the herd and not slaughtered. Additionally, we did not include the intermediate stocker phase to simplify the LCA.
On the other hand, we extended the end boundary of the LCA to the dinner plate rather than at the farm gate despite the increased complexity. This is because a key selling point of grass-fed beef is the local aspect is and transportation is a potential source of GHG emission.
Our data was based primarily on an LCA by Pelletier et al. (2010) on beef production strategies in the Upper Midwestern United States because it addressed our question directly. The LCAs completed in Canada (Beuchemin et al. 2010) and the Northern Great Plains (Lupo et al. 2013) were used as supplemental sources of information. Although there may be differences in precipitation and other factors, results obtained from these regions are comparable because they are fairly close geographically and more importantly, they have similar short growing seasons and cold winters. Thus, they would face similar challenges and limitations. Furthermore, we justified or dismissed some of the assumptions made by Pelletier using other journal articles.
For this LCA, we focused on six key factors that affect GHG emissions in the two beef production systems: enteric fermentation, feed production, manure management, time, transportation, and carbon sequestration. The functional unit used for emissions in this study is kg CO2eq/kg live weight beef in order to assess the emission intensity of the two systems. Our predictions for the comparison of individual categories are shown in Table 1.
Table 1: Predicted Levels of GHG Emissions.
| Emission Sources |
Feedlot | Pasture |
|---|---|---|
| Time | Lower |
Higher |
| Feed Production |
Higher | Lower |
| Transportation | Higher | Lower |
| Enteric Fermentation |
Lower | Higher |
| Manure Management |
Even | Even |
| Carbon Sequestration |
None | Higher |
Results
Table 2: Levels of GHG Emissions based on Pelletier model.
| Emission Sources |
Feedlot | Pasture |
|---|---|---|
| Time (days) | 303 |
450 |
| Final Live Weight (kg) | 637 |
505 |
| Feed Production (kg CO2 eq/kg live weight) |
1.47 | 3.14 |
| Transportation (kg CO2 eq/kg live weight) | - | - |
| Enteric Fermentation (kg CO2 eq/kg live weight) | 2.20 | 3.56 |
| Manure Management (kg CO2 eq/kg live weight) | 1.67 | 2.11 |
| Total (kg CO2 eq/kg live weight) | 5.48 | 8.58 |
| Carbon Sequestration (kg CO2 eq/kg live weight); | - | -3.55 |
| Total with Carbon Sequestration Factor (kg CO2 eq/kg live weight) | 5.48 | 5.03 |
Time
The time listed in the table includes only the time the steers spent in the finishing phase and not the time spent grazing in the cow-calf phase. In this scenario, cattle finished in pasture were fed for 147 days more days than cattle finished in feedlot. This was a common trend among grass-fed producers because pasture has lower growth rates due to forage being a low energy density diet. A survey by Lozier et al. (2008) found that the typical age of slaughter for pasture-finished steers was 21 months, which comes out to about 15 months or 450 days on pasture for finishing after subtracting the 6 months associated with the cow-calf phase. While time is not a direct source of GHG emissions, it has an indirect effect on all of the other key factors. The longer an animal is alive, the more feed it will consume and the more manure it will produce. As it consumes more feed, there will be more GHG emissions from enteric fermentation necessary to digest that feed as well as more emissions from producing that feed.
Final Live Weight
The final live weight is a key component to convert the total GHG emissions provided by Pelletier into our functional unit of kg CO2eq/kg live weight beef. In the scenario, Pelletier made the assumptions that the feedlot-finished steers will finish at 637 kg while pasture-finished beef will finish at 505 kg. The 637 kg for the feedlot-finished steers is reasonable because it is the typical target weight for commodity beef. From the Lozier survey, the typical weight at slaughter is 445 kg, which is slightly lower than that the Pelletier assumption. Because the survey included producers from less productive regions than the Midwest, 505 kg would be a reasonable estimate for our study. The fact that feedlot-finished steers have a higher final weight makes a big difference in our calculations since producing more product will favor the feedlot system by diffusing their emissions. However, that is the reality of the differences between the two beef production systems.
| Table 3: CO2 equivalents of feed for pasture vs. feedlot (Adapted from White 2014) | |||
| Feed | ME (Mcal/kg DM) | CO2-equivalents (kg/ha) | Yield (kg DM/ha) |
|---|---|---|---|
| Alfalfa | 2.24 | 224.57 | 7556 |
| Corn Grain | 3.39 | 228.98 | 9521 |
| Soybean Meal | 3.04 | 117.77 | 2841 |
| Control Pasture | 2.57 | 11.8 | 3261 |
| Fertilized Pasture | 2.2.57 | 161 | 4255 |
Feed Production
GHG emissions from feed production for pasture-finished beef was found to be double that from the feedlot system. A major reason for this is the time factor mentioned earlier, but there are two additional considerations.
First, N input in the form of fertilizers contribute to N2O emissions. A feedlot relies on grain production, which is associated with its own GHG emissions. For example, corn grain is a popular feedstuff used in feedlots, but corn is known to be a very N intensive crop and requires heavy N fertilizer input. In contrast, a pasture may theoretically require relatively low additional inputs due to natural fertilization from manure from the grazing animals. However, that may not always be the case. Some producers may still use fertilizers heavily since a higher quality feed often needs more N input (Phillips et al. 2011). One of the assumption in the Pelletier calculation is that the pasture and hay cultivated for beef production actually uses a comparable input of N fertilizer (112 kg/ha for brome pasture vs 145 kg/ha for corn). This assumption may not reflect the situation in the small rotationally grazed beef pasture popular among pasture-finish producers that is intensively managed and supplemented with legumes (Lozier 2008). This means GHG emissions for pasture-finish systems may be lower than Pelletier’s estimate.
Second, there is the challenge of long winters for grass-fed beef production in the Upper Midwestern U.S. Because the winter prevents grazing, the producer needs to provide winter hay to the steers. Drying the hay is an energy intensive process and is associated with a high level of CO2 emissions, which accounts for another source of GHG emissions. This may counteract the reduced GHG emissions from an intensively managed pasture.
In Table 3 we can see the differences in CO2 equivalents for each feed source. Looking at CO2 equivalents relative to the yield, you see that a low input pasture also has lower yield compared to one that is fertilized. Forage based feed also has similar CO2 equivalents as corn grain feed.
 |
| Figure 1: GHG emissions of various factors in beef production. NO=Normal Operation: feedlot and backgrounding, GF=Grass Fed: pasture based (Lupo 2013) |
Transportation
Transportation was left blank in Table 1 because it was not found to be a significant source of GHG emissions relative to the previously mentioned sources of GHG emissions. This was because Pelletier made the assumptions that corn feed would be transported 30 km by truck while all other non-pasture feed inputs would be transported 100 km to reflect additional transport for processing. Meanwhile, Lupo assumed transportation distances for distiller’s grains, soy, and wheat products to be 80 km, 60 km for raw agricultural products, and 15 km for hay. The authors from both studies justified this assumption by claiming that the feed would be locally sourced. While these distances transported assumed by Pelletier and Lupo seemed to be rather low, they may not be too far from reality as an analysis of feedlot locations by Clary et al. (1986) had demonstrated the dominance of feedlots located near the corn belt of the United States due to the proximity of the feed.
While we hoped to find data on the post processing transportation, the LCAs we found all set their end boundary at the farm gate. That said, given that our theoretical dinner plate would be in the Midwest where the beef is produced, we might expect the same level of low transportation distances seen with the feed. Further research needs to be done to explore the distances traveled by beef after processing.
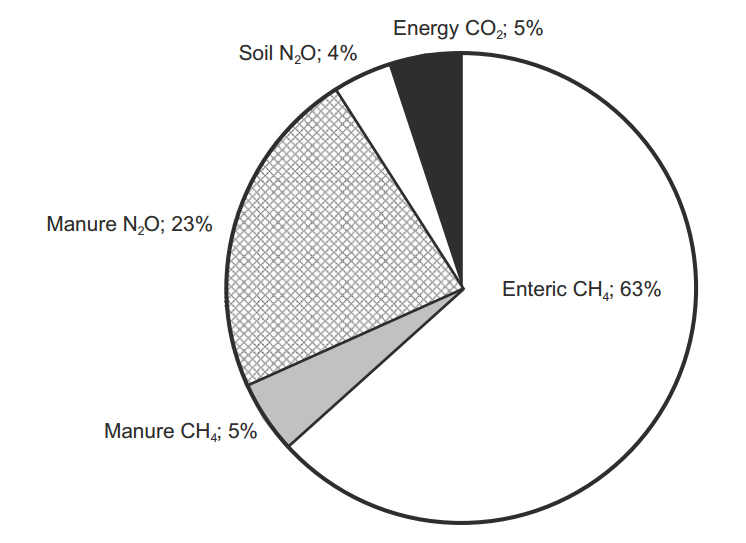 |
| Figure 2: GHG emissions in CO2 equivalents, % of total emissions. Results from a beef farm in western Canada. (Beauchemin 2010) |
Enteric Fermentation
Pasture and the high NDF forage results in more emissions from enteric fermentation due to the dependence on ruminal digestion. Feedlot utilizes more energy efficient feeds such as grains that can be digested quickly and result in less emissions from fermentation. Additionally, higher quality forage will result in less emissions.
For grass fed systems: "A significant increase in GHG emissions (37%) was observed, which was attributed to the increase in enteric emissions associated with a longer finishing time and lower finishing weight (Lupo 2013)."
Figure 2 illustrates that enteric fermentation is the largest contributor to GHG emissions from a whole-farm system perspective. The study that produced figure 2 was done in Western Canada, but they confirm that these reports are similar to studies done in North America that conclude enteric emissions are 40-70% of total GHG emissions. From this data we gather that differences in enteric fermentation emissions between feedlots and pastures will have a larger impact on total GHG emissions from each system.
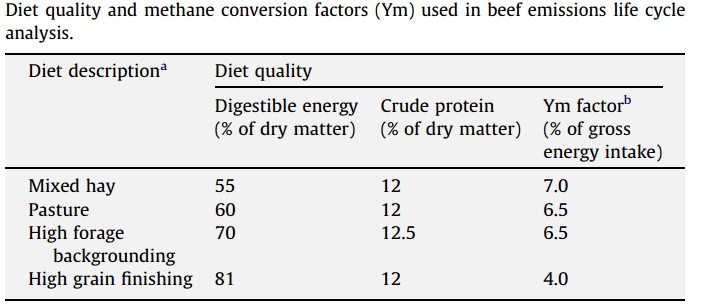
Table 4 depicts the differences in diet quality between pasture systems and high grain finishing systems, which would be feedlots. From this table it is obvious that the amount of digestible energy (DE) in high grain diets, 81%, is much higher than pasture diets, 60%. This means that cows on pastures will produce a higher amount of methane from enteric emissions due to a lower amount of DE, compared to feedlot cows. The conversion factors used in the Pelletier study were slightly different due to different diet formulations but the trend is the same.
| Table 4: Amount of Digestible energy (DE) in percent of dry matter for Pasture vs High Grain Finishing (Feedlot). (Beauchemin 2010) |
 |
Manure Management
Manure management includes both manure deposition and manure storage. Manure deposition is associated with the pasture finishing system since the manure is left in the field to fertilize the forage, which gives time for nitrous oxide to form. An intensively managed rotational grazing system may allow the most even spread of manure nutrients across the land. Manure storage is associated with the feedlot system since manure will be scraped from what are likely concrete lots and then stored in some manner for later use, which will result in emissions as it sits.
GHG emissions from manure management for pasture-finished beef was found to be about 26% higher than for feedlot-finished beef. This is one of the more uncertain categories due to differences in practices among producers. For example, Pelletier assumed that manure in the feedlot-finishing systems was scraped from feedlots and applied to agricultural land within a 5km radius. Meanwhile, Lupo assumed confined feedlots where all manure was collected, composted, and returned to the field. Beuchemin also assumed a confined feedlot pen system, but added the complication of deep bedding with barley straw. The differences in these models reflect the variation in manure management practices that are possible among producers. Variables influencing the amount of GHG emissions from storage and treatment of manure depends on the amount of manure produced, its C and N content, the proportion that decomposes anaerobically, and the temperature, duration and type of storage (Crosson et al. 2011). The management of manure for pasture-finish systems were more uniform and all three studies assumed that all manure were deposited directly to pasture and the GHG emitted was primarily N2O. The emissions were then calculated based on the N excreted and the associated emission factor associated with the type of animal and wetness of the manure. It was difficult to draw a conclusion on the emissions from manure management but this was also a category with one of the smaller differences between the two systems, so it may be less important in the comparison.
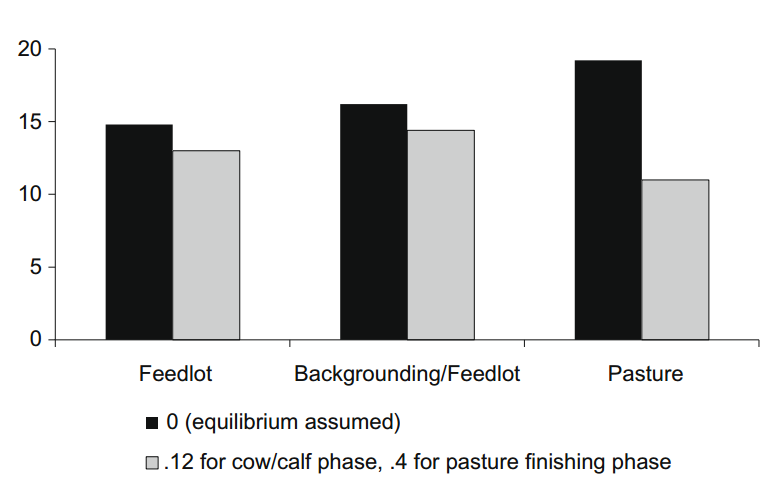 |
| Figure 3: Comparing effect of carbon sequestration on total emissions, feedlot vs pasture. (Pelletier 2010) |
Carbon Sequestration
Carbon sequestration was the key to the difference between conventional and pasture based in the O'Brien paper. And this is again the case in beef finishing systems.
WCarbon sequestration was found to be the key factor when comparing GHG emissions between two beef production systems. Without considering carbon sequestration, the pasture-finished beef emitted significantly more GHG/kg live weight than the feedlot-finished beef. Including the mitigation effect from soil organic carbon (SOC) changed the conclusion, dropping the emissions from pasture-finished beef to about 10% less than that from the feedlot-finished beef. This dramatic difference is due to grass and other forage plants having a larger capacity to convert CO2 into SOC (because of the extent of root growth) than grains and other feed used in the conventional feedlot finishing systems. Although recent evidence supports the inclusion of SOC in total GHG emissions, there has been debate over how long pastures can sequester carbon (Lupo 2013). Further research into carbon sequestration is necessary to better quantify the effects it has on the GHG emission from pasture based beef production systems.
Figure 3 shows that SOC accrual brings GHG emissions of pasture systems to a lower amount than feedlot. Notably, this figure includes the cow-calf phase, where as our study is strictly the finishing phase. That said, because the cow-calf phase is similar, the C sequestration from the cow-calf pasture system should be the same. Therefore, the main contributor to this drastic mitigation effect would be from finishing on pasture instead of feedlot. Our results in Table 2, though from the same study, are calculated with data only in the finishing stage. As seen in Table 2, C sequestration mitigates GHG emissions enough to change the final results.
Discussion
The key finding from this study is that carbon sequestration is the differentiating factor that determines which finishing system has the lower GHG emissions. As mentioned, there is a high level of uncertainty associated with the estimates for the amount of GHG mitigation that carbon sequestration can provide. Therefore, although we did use the estimates for carbon sequestration for this broad overview, further research into the effects of carbon sequestration and how it is estimated would be important.
Setting carbon sequestration aside, grain-fed beef has much higher GHG emissions than other meat species such as chickens and pigs that can utilize the same feed source much more efficiently. In contrast, grass-fed beef would have similar GHG emissions as other meat species that can utilize grass as a feed source, namely other ruminants. With that in mind, it may not be a fair comparison between grain-fed and grass-fed animals. Instead, Whole Foods can perhaps advertise the fact that forage based systems allow producers to capture nutrients in feeds that are not digestible by humans.
Limitations
A key aspect that led to our heavy reliance on the Pelletier data is the fact that the authors were specifically trying to model beef finishing strategies in the Upper Midwestern United States, which is the location we are addressing. However, GHG emissions can vary dramatically between beef producers in different regions using the same type of finishing system due to differences many factors that contribute to GHG emissions, such as climate and the availability of water, resources, and technology.mTherefore, our finding can not be applied more generally to beef finishing systems in other locations.
One of the limitations of the Pelletier study is the 75 animal model. While it is useful to control of the number of animals in making the comparison, it does not accurately reflect the number of animals on the farm. Feedlots are expected to have a lot more. Small pastures that may provide the grassfed beef would likely have a lot less. Or maybe the pasture is pretty big and has a lot of animals since it has to provide for Whole Foods and intensively managed with high levels of fertilizers. The different number of animals can reflect the different intensity of a particular producer, which can affect how efficient the animals are.
Conclusion
After considering each factor in the LCA, we conclude that conventional feedlot finishing systems have higher GHG emissions than pasture based systems. Carbon sequestration was the key difference maker and decreased the emissions of pasture systems by a large extent to bring the total emissions below that of feedlot systems.
From our research, we have found evidence to justify an increase in the premium on grass fed beef by Whole Foods. Since grass fed beef has less GHG emissions overall, should be able to command a premium. That said, feedlot systems have lower emissions for all other categories due to the efficient feed and the high growth rates and further research to validate the impact of carbon sequestration would be important to strengthen this claim.
Citations
Beauchemin K, Janzen H, Little S, McAllister T, McGinn S. (2010) Life cycle assessment of greenhouse gas emissions from beef production in western Canada: A case study. Agriculture Systems 103:371-379
Cattlemen's Beef Board and National Cattlemen's Beef Association. (2015) Raising Beef. ExploreBeef. http://www.explorebeef.org/raisingbeef.aspx Accessed 24 April 2015
Clary GM, Dietrich RA, Farris DE. (1987) Effects of increased transportation costs on spatial price differences and optimum locations of cattle feeding and slaughter. Agribusiness 2:235-246
Crosson P, Shalloo L, O’Brien D, Lanigan GJ, Foley PA, Boland TM, Kenny DA. (2011) A review of whole farm
systems models of greenhouse gas emissions from beef and dairy cattle production systems. Animal Feed Science and Technology 166:29-45.
Lozier J, Rayburn E, Shaw J (2004) Growing and selling pasture-finished beef: Results of a nationwide survey. Journal of Sustainable Agriculture 25:93-112.
Lupo CD, Clay DE, Benning JL, Stone JJ. (2013) Life-cycle assessment of the beef cattle production system for the northern great plains, USA. Environ Qual 42:1386-94.
Pelletier N, Pirog R, Rasmussen R. (2010) Comparative life cycle environmental impacts of three beef production strategies in the Upper Midwestern United States. Agricultural Systems 103(6):380-389.
Phillips WA, Horn GW, Cole NA (2011) The Relevancy of Forage Quality to Beef Production. Crop Science 51:410-419.
Sousanna J, Tallec T, Blanfort V. (2009) Mitigating the greenhouse gas balance of ruminant production systems through carbon sequestration in grasslands. Animal 3(4):334-350
USDA (2008) Grass fed marketing claim standards. USDA Marketing Claim Service. http://www.ams.usda.gov/AMSv1.0/ams.fetchTemplateData.do?template=TemplateN&rightNav1=GrassFedMarketingClaimStandards&topNav=&leftNav=GradingCertificationandVerfication&page=GrassFedMarketingClaims&resultType Accessed 24 April 2015
White R, Brady M, Capper J, Johnson K. (2014) Optimizing diet and pasture management to improve sustainability of U.S. beef production. Agricultural Systems 130:1-13
