Topics Map > Tableau
Accessibility tips and tricks for Tableau visualizations
Making our content accessible benefits everyone. It allows a wider audience to reach our content. This is especially crucial for users who surf web through assistive technology.
Beside that, it is a compliance matter and by law, electronic content must be available for all audience. You can read more on section 508 here: https://www.section508.gov/manage/laws-and-policies
The Web Content Accessibility Guidelines (WCAG) is a globally used source for compliance. It has been developed and maintained by Web Accessibility Initiative. These guidelines help developers implement accessibility into their electronic content.
Although Tableau is not fully accessible at the moment, but the company has started implementing accessibility features and started rolling out accessibility in their visual components. As developers, we need to do our best to make our visuals accessible to all audience. This document is meant to serve as a helping guide to implement accessibility in our workbooks. Here are some tips and tricks that can help us with that.
Alternative texts
Adding alternative texts to images will help screen readers to interpret the image correctly. All images on workbooks must have an alternative text. A simple, to the point text that describes the image.
Here is a KB on how to add alternative texts in Tableau:
How to add alternative text to images in Tableau
Making dynamic visualizations' data accessible
Make sure to have data summary turned on, so the screen readers can scan that for their users.
Make sure to add a caption describing what the visualization is showing in general.
Color-blind friendly content
Contrast ratio
A contrast ratio of at least 3:1 between adjacent colors is required. This contrast ratio must be maintained regardless of what color palette is used. Here are the related guidelines:
https://www.w3.org/TR/WCAG21/#non-text-contrast
Don’t rely on color only
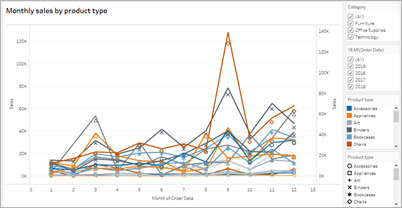
Do not use color as the only means for distinguishing data.
Use labels, shapes, borders.

Here is a KB on how to add borders to your visualization:
How to test contrast
There are several tools that you can use to test the color contrast. The rule of thumb is that adjacent colors should still be distinguishable on a gray scale.
There are several tools that can be used for testing the contrast:
High contrast chrome extension
The High contrast chrome extension shows the page on a grayscale. The extension can be found here:
https://chrome.google.com/webstore/detail/high-contrast/djcfdncoelnlbldjfhinnjlhdjlikmph?hl=en
WebAim Contrast Checker
This contrast checker takes two colors and compares them. It will provide the contrast ratio. One of the good features of this tool is that it also has an API that is free to use:
https://webaim.org/resources/contrastchecker/
A sample API call (all you need to do is to replace the values for fcolor and bcolor):
https://webaim.org/resources/contrastchecker/?fcolor=0000FF&bcolor=FFFFFF&api
Other tips
It is advised to avoid using the following color combinations: Green – Red; Blue – Yellow.
UW-Madison color palettes
There is a cheat sheet of color combinations contrast ratio for UW-Madison’s categorical color palette.
You can download it through the following link:
https://kb.wisc.edu/msndata/113177
Provide context
There should be sufficient description and caption on the viz to help everyone perceive the content. Use labels as much as you can.
For more information on best practices, please take a look at the following link:
https://help.tableau.com/current/pro/desktop/en-us/accessibility_best_practice.htm
