HelioCampus AC - Eval Results - Course Evaluation Analysis Report (Admin) [UW-Madison]
Report Options
Every HelioCampus AC Course Evaluation report has a panel of report parameters similar to the one shown below. The key parameters, and their behavior are outlined here:
Term
- Select the semester to be reported.
- You can select multiple semesters.
College
- Options defined by your HelioCampus AC user account.
Department
- Options defined by your HelioCampus AC user account.
Course
- This field may be left blank to show all courses in the report.
- The field may appear empty, but begin typing the course name to trigger the filter.
- Select from courses that were available during that semester.
- You can select multiple courses or leave it blank for all courses.
Instructor
- This field may be left blank to show all instructors in the report.
- This field may appear empty, but begin typing the instructor's name to trigger the filter.
Survey Type
- Most of the time, HelioCampus AC users are working with Student Course Evaluations.
Aggregate Level
- The level at which HelioCampus AC organizes the information when compiling data.
- Remember instructors are only available at the course section level.
Survey
- You must select a survey, even if only one survey is listed.
Completed Surveys Only
- If any surveys are in Pending Results, the data will only be included if unchecked. However, most reports are created after the semester is done and all surveys are complete so leaving it checked is fine.
Reset Parameters
- Resets all parameters back to default values (useful when you have made several attempts).
- Since multiple fields allow you to select multiple items, "resetting" parameters quickly erases all selected options.
Run Report
- This may take several seconds or minutes to complete, depending on the quantity of data.
- The page will load with a new view. (Explained in Report Details, next.)
Report Details

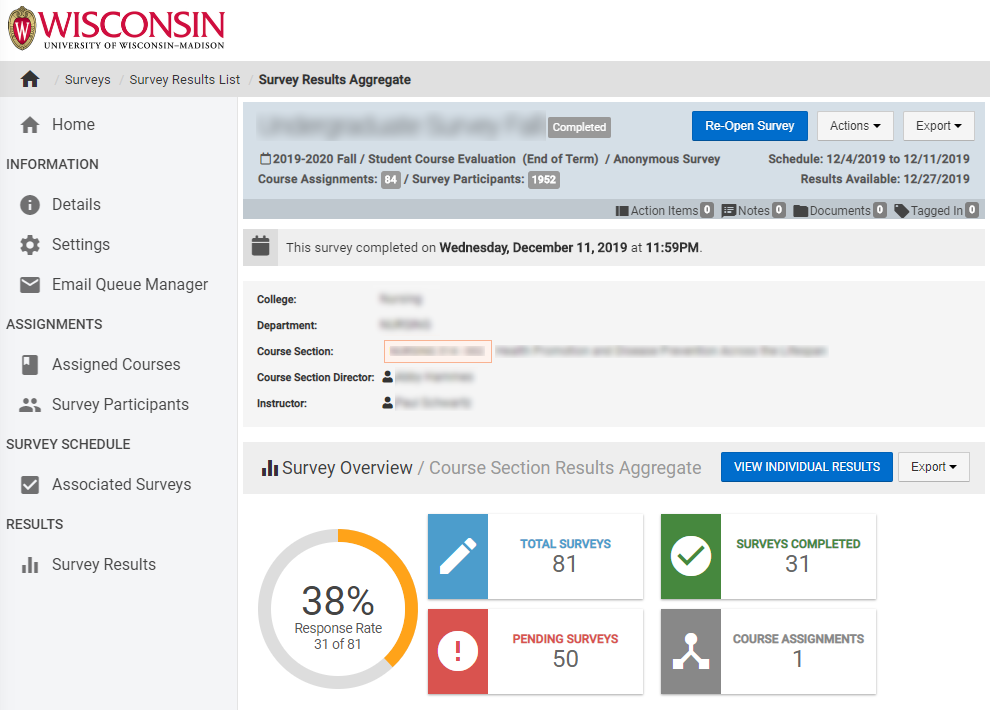
Two sets of information are readily available in this summary view:
- If your survey has any metrics, they are represented by the blue bar-graphs.
- The total response rate is represented by the colored circle graph.
View Results
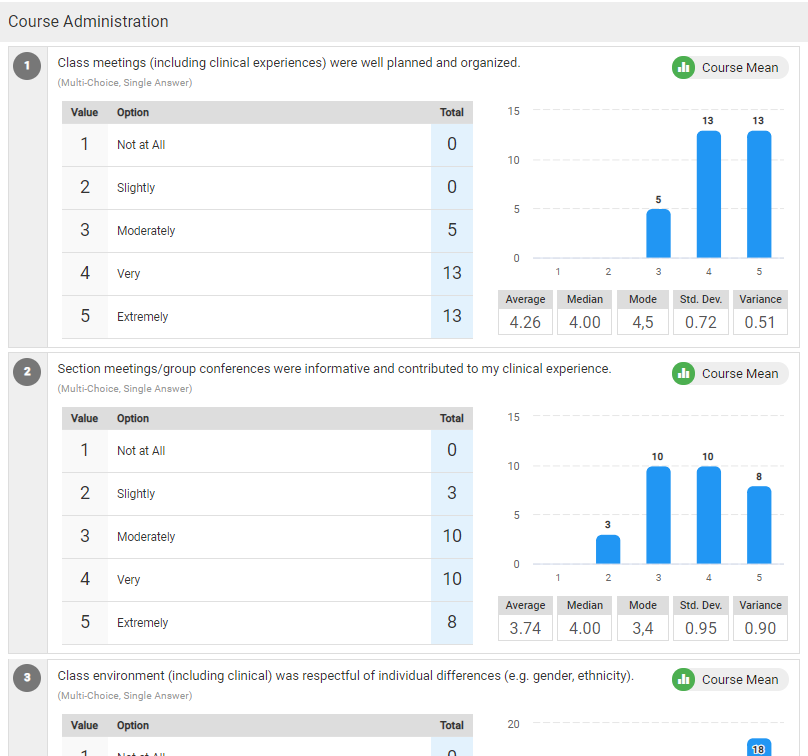
To view a more detailed analysis of the evaluation responses, including a breakdown per question, click the Results options, located to the right.
Note: When you run the report it will give you the results for each section. If you click the white box on the right side, you can choose the first 50 or second 50 depending on results. You can only select 50 at a time. If you click the Export button, you can choose to download the aggregate results as PDF Selected or PDF ZIP Selected. PDF Selected gives one large PDF file, but the PDF ZIP selected will create a folder with all the results in individual files.

Print & Export
Click the Export button. You should see an export option to choose the Aggregate Results or Individual Results. The top PDF, Print, and CSV will only export what is on the screen. If you want the individual faculty reports, then choose the Aggregate Results PDF Selected or PDF ZIP Selected. If you only see Export PDF, Print, or CSV, unselect one of the sections and re-select the section. Now click Export and the various options appear.

Note: If you click the white box on the right side, you can choose the first 50 or second 50 depending on results. You can only select 50 at a time. If you click the Export button, you can choose to download the aggregate results as PDF Selected or PDF ZIP Selected. PDF Selected gives one large PDF file, but the PDF ZIP selected will create a folder with all the results in individual files.


