HelioCampus AC - Eval Results - Course Section Trend Analysis Report (Instructor) [UW-Madison]
HelioCampus AC offers several reports to help compile and organize the responses from course evaluations. For general information about these reports, visit HelioCampus AC - Eval Results - Reports Library (Instructor) [UW-Madison] .
Report Parameters
Every HelioCampus AC Course Evaluation report has a panel of report parameters similar to the one shown below. The key parameters, and their behavior are outlined here:

Aggregate Level
- You must choose a level at which HelioCampus AC will combine and order your data. (Only one can be selected.)
- Options are: Instructor or Course Section
Statistics
Three options (you may select multiple)
- Average
- Mode
- Standard Deviation
Compare With
Four options
- Institution
- College
- Department
- Course
Term
- Select the semester to be reported.
- You can select multiple semesters.
College
- Instructors can only see their own evaluations.
- Most instructors cannot toggle "College".
Department
- Instructors can only see their own evaluations.
- Most instructors cannot toggle "Department".
Course
- This field may be left blank to show all courses in the report.
- It may appear empty, but begin typing the course name to trigger the filter.
- Select from courses that were available during that semester.
- You can select multiple courses or leave blank for all courses.
Instructor
- Instructors can only see their own evaluations.
- Most instructors cannot toggle "Instructor".
Course Section
You may select up to 10 course sections or leave blank for all course sections.
Survey
You must select a survey, even if only one survey is listed.
Show Comments
Determines whether the responses to memo-type questions are included in this trend analysis.
Reset Parameters
Resets all parameters back to default values. This is useful when you have made several attempts. Since multiple fields allow you to select multiple items, resetting parameters quickly erases all selected options.
Run Report
- This may take several seconds to complete.
- The page will load in a new view. (Explained in Report Details, next.)
Report Details
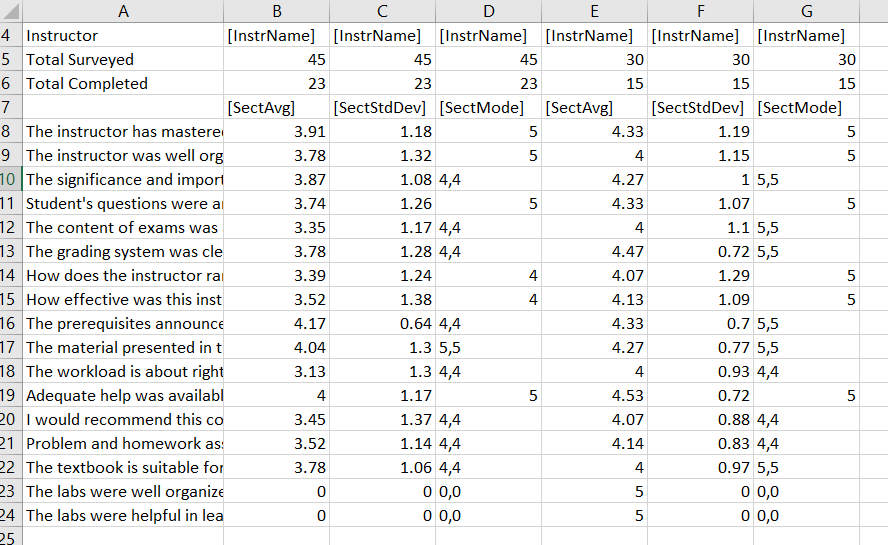
Depending on the parameters chosen, you may see information on the screen. However, in most instances, the system will say to export to view results. You are encouraged to always export to see the condensed view, which is a custom-designed report, requested by UW-Madison.

Export
(The on-screen display of the report is not as nicely formatted as other reports. Usually, users opt to export the data into a .csv file for better analysis.)
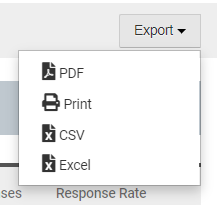
Click Export to export this information to a .pdf, .csv or .xlsx file (pictured below).


