
WiscIT (Cherwell) - Impact Analysis & Visualizations, Calendars
WiscIT (Cherwell) has visualization tools that aid with impact analysis. This native ability replaces the home-grown service, CMDB Tools.
Impact Analysis & Visualizations
WiscIT (Cherwell) has the ability to allow technologists to perform their own impact analysis. This is done through "visualizations".
To access Visualizations:
- Log into WiscIT
- Call up any configuration item.
- Tools
- Visualizations
- Visualization Manager
- Select the Visualization you want; a visualization that was created for quick response and easy impact analysis is in the Global folder for users: "Configuration Items - Only Servers Upward". This visualization excludes IP addresses and DNS records (including IP and DNS in a visualization can slow response time, due to the large number of potential records).
- After you select your visualization, it will appear in the Tools/Visualizations pick-list.
Below is a visualization of the Technical Service "SOLAR (FASTAR).
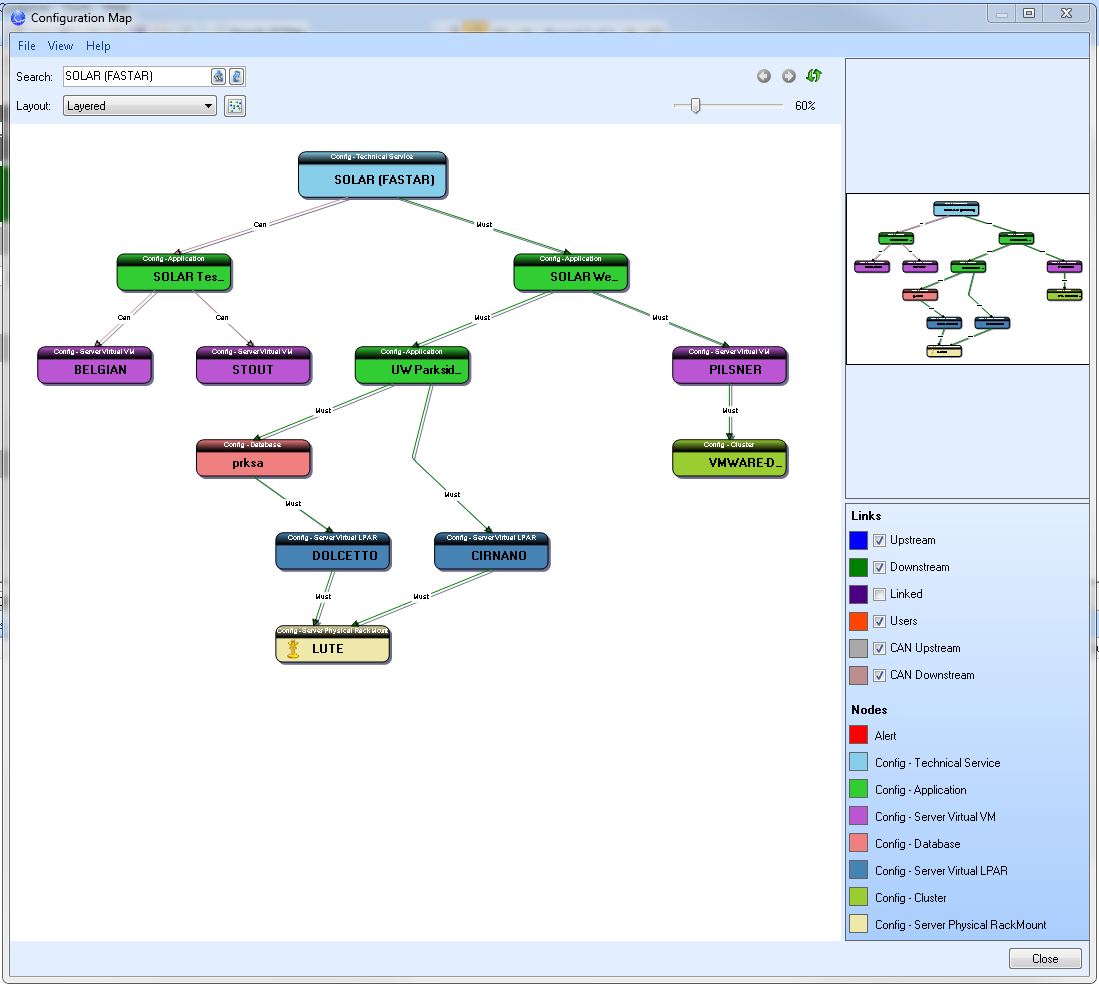
Please note:
- In the upper left, there are 2 picks:
- Search - you can enter a CI name here to do a new visualization
- Layout - choose the layout that works for you
- In the upper right is a window that, if there are many CIs displayed, you can use to scroll to a particular part of the visualization
- There is a scaler at the top
- In the lower right, there is a legend outlining
- Links - the relationships between CIs - one can choose the types to display
- Nodes - the CI types displayed in this visualization
Looking at the above example, one could say the following:
- SOLAR can have the Test environ, and must have the website
- The prksa database must have server DOLCETTO
- The UW-Parkside Student Administration-SOLAR app must have the prksa database and the server CIRNANO.
Calendars
WiscIT (Cherwell) has useful calendars built into the tool.
To access Calendars:
- Log into WiscIT
- Tools
- Calendars
- Calendar Manager
- Select the Calendar you want; a combined calendar was created for general use is in the Global folder for
users: "Change Impact Analysis Calendar". This calendar includes Planned, Unplanned and Emergency Changes and Timeframes.
- After you select your calendar, it will appear in the Tools/Calendars pick-list.
Below is the calendar for the week of November 9-15.
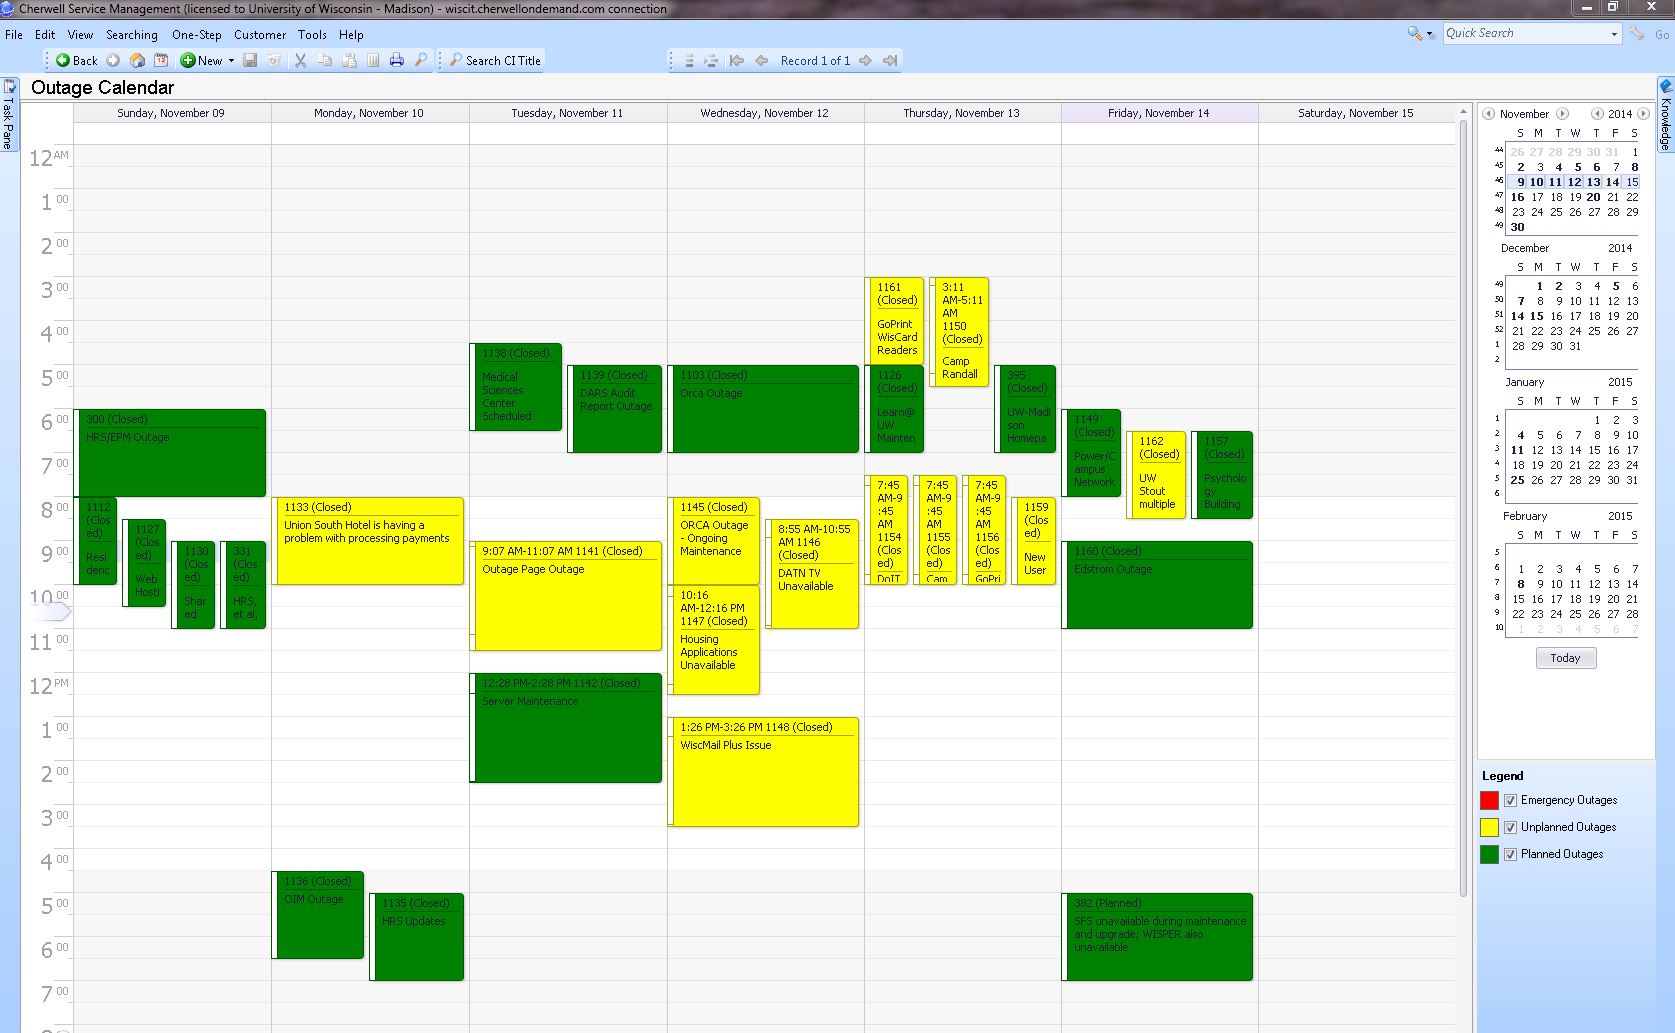
Please note:
- You can select a date or range to view on the right
- You can select what types of outages to view in the lower right.
- To get the details on an outage, double-click it. The outage record will come up, and one can peruse the relevant Changes, Incidents, Problems or Configuration Items.